Market Sentiment Index August 2019
Highlights
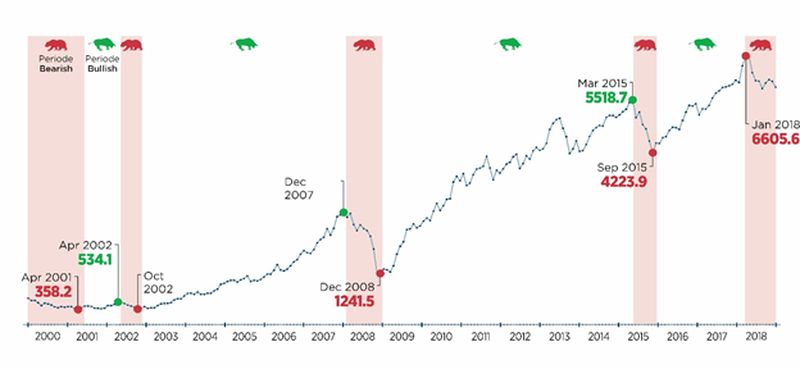
Bullish and Bearish are simple terms that are used in capital market to characterized trends. Bullish is defined as a rise in price (IHSG) over a long period of time, while Bearish is a decline in prices (IHSG) and an increase in volatility.
The necessity of identifying stock market current condition, and its projection is high, particularly for investors and regulators.
Katadata Insight Center (KIC) conducted a comprehensive research in identifying bearish and/or bullish period of Indonesia Composite Index (ICI).
Our team developed a logistic model that combine the domestic and global macroeconomic indicator to the market condition, in order to predict the market condition on the next period.
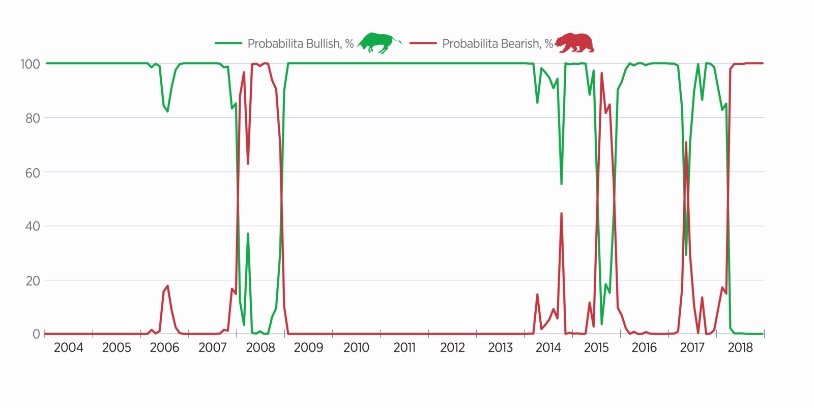
The logistic model deliver market condition probability (bearish or bullish). Bullish condition is recognized should the index value reached ≥ 50%. Conversely, bearish condition is recognized should the index value reached < 50%.
For this reasons, Katadata Insight Center (KIC) has developed a logistic model by identifying the IDX Composite Bearish and Bullish period as well as the indicators of domestic and global macroeconomics, in order to project the prediction for the next period, available through Katadata Market Sentiment Index that will be publish in monthly basis.
Methodology
- Literature Study: research report collection process, for reference purposes.
- Secondary Data Collection: Indonesia Composite Index (ICI), as well as the domestic and global macroeconomic indicator.
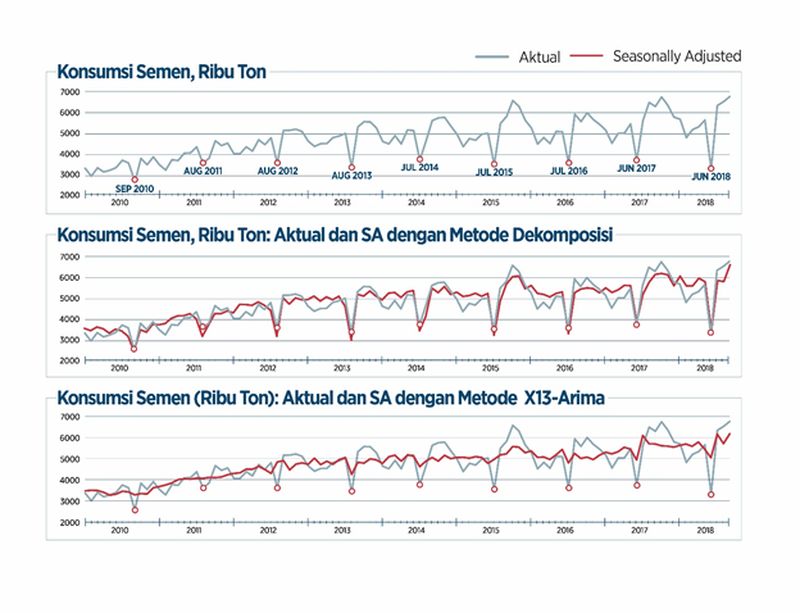
- Seasonal adjustment (SA): applied to the data that significantly affected by seasonal factor.
- Indonesia Composite Index (ICI) Identification: in identifying the bearish and bullish period.
- Indonesia Composite Index (ICI) condition modelling.
- Prediction of Indonesia Composite Index (ICI) condition: predicting Indonesia Composite Index (ICI) condition, whether the condition will be bearish or even bullish.
Seasonal Adjustment
Bulllish and Bearish Identification Period
Bearish and Bullish period identification by Bry-Boschan Algorithm
Prediction Using Logistic Model
Logistic model prediction (August 2003 to August 2018)
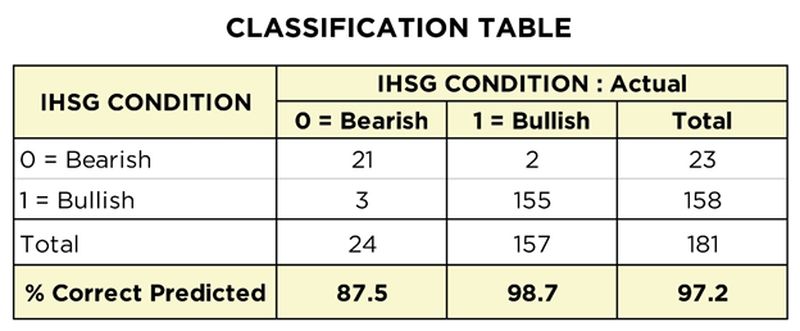
Our Logistic model predicted 87.5% bearish and 98.7% bullish. In total, the logistic model have predicted 97.2% bearish and bullish condition, resulting 2.8% error prediction.
Market Prediction Condition
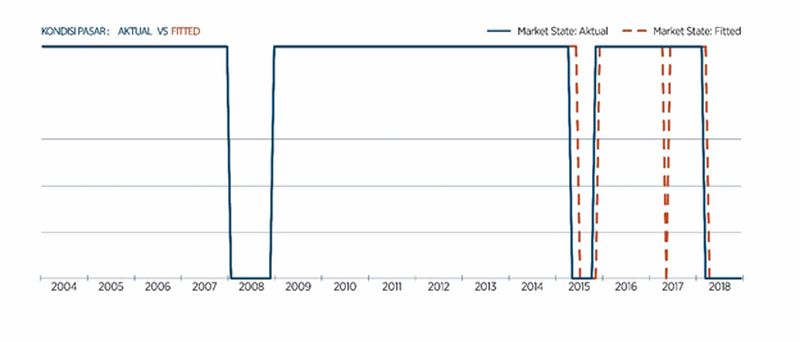
Prediction on Market Condition: Actual vs. Fitted (1=Bullish, 0= Bearish) to November 2018
Katadata Market Sentiment Index
Katadata Market Sentiment Index up to November 2018
For more details, download full report here.


